D-Illuminant Computation
Source from http://en.wikipedia.org/wiki/Standard_illuminant#Illuminant_series_D
Derived by Judd, MacAdam, and Wyszecki, the D series of illuminants are constructed to represent natural daylight. They are difficult to produce artificially, but are easy to characterize mathematically.
H. W. Budde of the National Research Council of Canada in Ottawa, H. R. Condit and F. Grum of the Eastman Kodak Company in Rochester, New York, and S. T. Henderson and D. Hodgkiss of Thorn Electrical Industries in Enfield had independently measured the spectral power distribution (SPD) of daylight from 330 to 700 nm, totaling among them 622 samples. Judd et al. analyzed these samples and found that the (x,y) chromaticity coordinates had a simple, quadratic relation:
- <math>y=2.870x - 3.000x^2 - 0.275</math>.
Simonds supervised the characteristic vector analysis of the SPDs. Application of his method revealed that the SPDs could be satisfactorily approximated by using the mean (S0) and first two characteristic vectors (S1 and S2):
- <math>S(\lambda) = S_0(\lambda) + M_1 S_1(\lambda) + M_2 S_2(\lambda)</math>
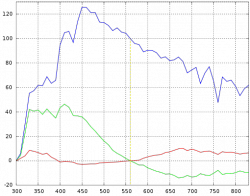
In simpler terms, the SPD of the studied daylight samples can be expressed as the linear combination of three, fixed SPDs. The first vector (S0) is the mean of all the SPD samples, which is the best reconstituted SPD that can be formed with only a fixed vector. The second vector (S1) corresponds to yellow–blue variation, accounting for changes in the correlated color temperature due to presence or absence of clouds or direct sunlight. The third vector (S2) corresponds to pink–green variation caused by the presence of water in the form of vapor and haze.
To construct a daylight simulator of a particular correlated color temperature one merely needs to know the coefficients M1 and M2 of the characteristic vectors S1 and S2.
Expressing the chromaticities x and y as:
<math>x=\frac{X_0+M_1 X_1+M_2 X_2}{S_0+M_1 S_1 + M_2 S_2}</math>
<math>y=\frac{Y_0+M_1 Y_1+M_2 Y_2}{S_0+M_1 S_1 + M_2 S_2}</math>
and making use of known tristimulus values for the mean vectors, they were able to express M1 and M2 as follows:
<math>M_1=\frac{-1.3515-1.7703x+5.9114y}{0.0241+0.2562x-0.7341y}</math>
<math>M_2=\frac{0.0300-31.4424x+30.0717y}{0.0241+0.2562x-0.7341y}</math>
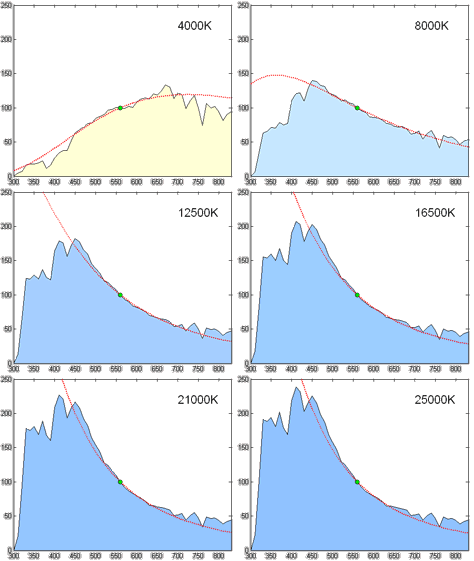
The only problem is that this left unsolved the computation of the coordinate <math>(x,y)</math> for a particular phase of daylight. Judd et al. simply tabulated the values of certain chromaticity coordinates, corresponding to commonly-used correlated color temperatures, such as 5500 K, 6500 K, and 7500 K. For other color temperatures, one could consult figures made by Kelly. This problem was addressed in the CIE report that formalized illuminant D, with an approximation of the x coordinate in terms of the reciprocal color temperature, valid from 4000 K to 25,000 K. The y coordinate trivially followed from Judd's quadratic relation.
Judd et al. then extended the reconstituted SPDs to 300–330 nm and 700–830 nm by using Moon's spectral absorbance data of the Earth's atmosphere.
The tabulated SPDs presented by the CIE today are derived by linear interpolatio] of the 10 nm data set down to 5 nm. The limited nature of the photometric data is not an impediment to the calculation of the CIEXYZ tristimulus values since the CIE standard colorimetric observer's color matching functions are only tabulated from 380 to 780 nm in increments of 5 nm.
Similar studies have been undertaken in other parts of the world, or repeating Judd et al.'s analysis with modern computational methods. In several of these studies, the daylight locus is notably closer to the Planckian locus than in Judd et al.
- Computation
The relative spectral power distribution (SPD) <math>S_D (\lambda)</math> of a D series illuminant can be derived from its chromaticity coordinates in the CIE 1931 color space, <math>(x_D,y_D)</math>:
<math>x_D = \begin{cases} 0.244063 + 0.09911 \frac{10^3}{T} + 2.9678 \frac{10^6}{T^2} - 4.6070 \frac{10^9}{T^3} & 4000K \leq T \leq 7000K \\ 0.237040 + 0.24748 \frac{10^3}{T} + 1.9018 \frac{10^6}{T^2} - 2.0064 \frac{10^9}{T^3} & 7000K < T \leq 25000K \end{cases}</math>
<math>y_D = -3.000 x_D^2 + 2.870 x_D - 0.275</math>
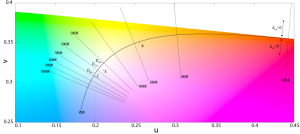
where T is the illuminant's CCT. The chromaticity coordinates of the Illuminants D are said to form the CIE Daylight Locus. The relative SPD is given by:
<math>S_D(\lambda)=S_0(\lambda)+M_1 S_1(\lambda)+M_2 S_2(\lambda)</math>
<math>M_1=(-1.3515-1.7703x_D+5.9114y_D)/M</math>
<math>M_2=(0.03000-31.4424x_D+30.0717y_D)/M</math>
<math>M=0.0241+0.2562x_D-0.7341y_D</math>
where <math>S_0(\lambda), S_1(\lambda), S_2(\lambda)</math> are the mean and first two eigenvector SPDs, depicted above. The characteristic vectors both have a zero at 560 nm, since all the relative SPDs have been normalized about this point.
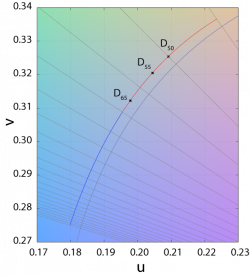
The CCTs of the canonical illuminants, D50, D55, D65, and D75, differ slightly from what their names suggest. For example, D50 has a CCT of 5003 K ("horizon" light), while D65 has a CCT of 6504 K (noon light). As explained in a previous section, this is because the value of the constants in Planck's law have been slightly changed since the definition of these canonical illuminants, whose SPDs are based on the original values in Planck's law.
Custom Illuminant Computation by Spectral Integration
By combining the spectral radiance given by Planck's law, and the spectral power distribution of the CIE Color Matching Functions, it's relatively easy to obtain the XYZ values of any white point given its Correlated Color Temperature.
You can find an example code here:
- ComputeWhitePointChromaticities.cpp <= Actual code
- ColorMatchingFunctions.cpp <= Giant array of spectral power distribution values
These 2 sources come from my personal library named God Complex.
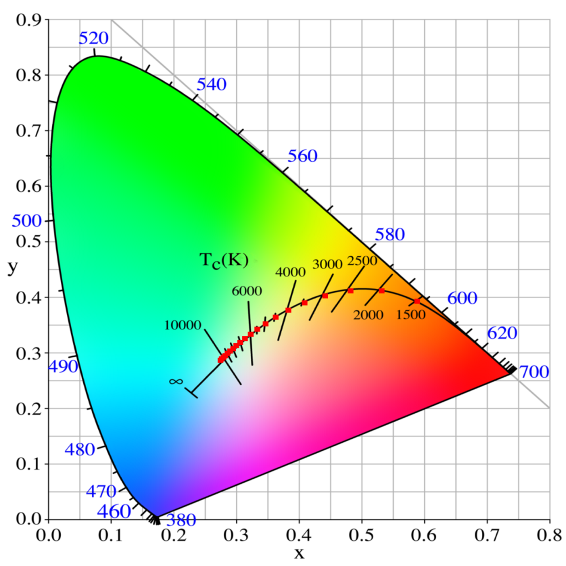
As you can see in the picture below, I'm plotting the loci of various white points from 1500K to 12000K by 500K increments and the results match pretty well (red dots).
